

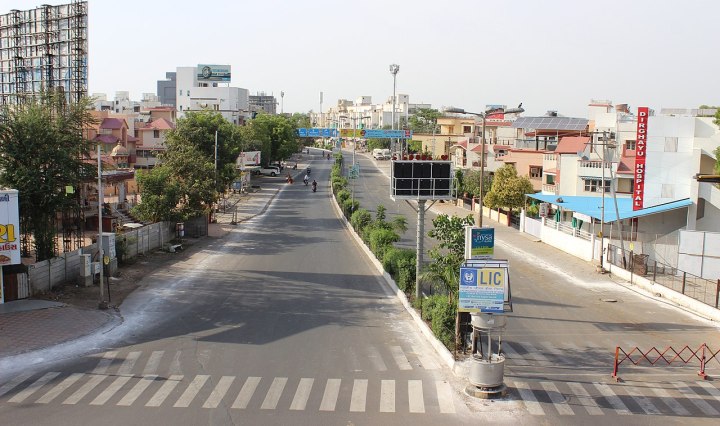
When the gates locked down: India in the time of Corona
The coronavirus (Covid-19) pandemic has affected the world. India has been hit too. However, India’s situation is unique because of its economic situation and migrant population, among other things. This article tries to capture the human aspect along with facts about the situation. Continue reading When the gates locked down: India in the time of Corona

R community update: announcing sessions for useR Delhi December meetup
As referenced in my last blog post, useR Delhi NCR is all set to host our second meetup on 15th December, i.e. upcoming Saturday. We’ve finalized two exciting speaker sessions for the same. They’re as follows: Basics of Shiny and … Continue reading R community update: announcing sessions for useR Delhi December meetup
R community update: announcing useR Delhi December meetup and CFP
Time really does fly. It’s been 5 months since Delhi NCR useR group had come into being and our first meetup. It was a successful event which included sessions featuring an R-core member and a veteran data scientist. More importantly, … Continue reading R community update: announcing useR Delhi December meetup and CFP

R community update: announcing useR Delhi July meetup
In my last post, I’d pointed out the importance of a local community and described how Delhi NCR useR group came about. It’s been a month since we’d started the group and I’m excited to announce that our first meetup is scheduled to take place on 14th July 2018, i.e. upcoming Saturday. Venue for the event is SocialCops headquarters in Saket, New Delhi. As a budding community, support from established organizations is a big boost, and we’re grateful to SocialCops for coming onboard as mentors and venue partners. Event details can be found on meetup and you can RSVP here … Continue reading R community update: announcing useR Delhi July meetup

How the ‘why’s drove the ‘what’: Epilogue
“Study hard what interests you the most in the most undisciplined, irreverent and original manner possible” – Richard Feynman As a deeply confused and somewhat optimistic sophomore, I was in a habit of taking witty quotes more seriously than most. The one above, for example, has guided how I have went about studying Machine Learning and related topics for the last two years or so. Then again, as a chemical engineering major in an Indian college with a tragically rigid curriculum, I didn’t have much of a choice. Fast forward a couple of years and after a few online courses, … Continue reading How the ‘why’s drove the ‘what’: Epilogue

Analyze pull requests and Travis builds using Rperform
Always code as if the guy who ends up maintaining your code will be a violent psychopath who knows where you live. – Martin Golding In previous posts, I had discussed how Rperform can be used to obtain and visualize package performance data. However, real-world software development is a collaborative process. Thus, automating performance testing for your package is not only a good idea, it’s a critical one; testing projects locally might not be good enough. This post will cover usage of Rperform with Travis CI for automated performance testing. More importantly, we will be able to assess performance impact … Continue reading Analyze pull requests and Travis builds using Rperform

Obtaining package performance data using Rperform
“In God we trust. All others must bring data.” – W. Edwards Deming In a previous post, I had discussed how Rperform uses the grammar of graphics approach to visualize an R package’s performance in terms of runtime and memory usage. The visualizations contribute significantly towards Rperform’s mission to allow package developers to quantify, analyze and visualize performance. However, at times you, the developer, might want to play with the data instead to perform analysis of your own. After going through this post, that is exactly what you would be able to do. Background If you are new to Rperform, consider … Continue reading Obtaining package performance data using Rperform

Visualizing package performance using Rperform and Grammar of Graphics
The greatest value of a picture is when it forces us to notice what we never expected to see. ―John Tukey Replace ‘picture’ in the above quote with ‘data visualization’ and it will still ring true; maybe even more so. To provide valuable insights to package developers is exactly what Rperform strives to do through it’s visualization functions. Background If you are new to Rperform, consider going through it’s Github README once. In a nutshell, Rperform is an R package that allows package developers to track and visualize quantitative performance metrics of their code, over time. It focuses on providing … Continue reading Visualizing package performance using Rperform and Grammar of Graphics

Technology in a rut
“You promised me Mars colonies. Instead, I got Facebook.” – Buzz Aldrin, MIT Tech Review 2012 The Apollo Mission, the controversy surrounding it’s verifiability notwithstanding, remains arguably the most audacious technological project ever undertaken successfully by humankind. A bunch of … Continue reading Technology in a rut
Rperform in Google Summer of Code 2016
Rperform had started as a GSoC 2015 project with an aim to “to provide a package with functions that make it easy for R package developers to track quantitative performance metrics of their code, over time.” Much of the functionality required for the same was implemented over the course of last summer. This included various performance visualization functions and integration with the Travis-CI workflow, among other things. The project has been accepted into the GSoC program again under the organization, R project for statistical computing. I will be working on it over the summer with my mentors, Toby Dylan Hocking … Continue reading Rperform in Google Summer of Code 2016
